What Uiprobe finds when it compares your Figma design to the live page
Spacing, typography, colour, size, content. Compared automatically, with the expected value from Figma and the actual value from the page, for every finding.
01
Visual comparison
Your Figma frame and the live page, rendered on one canvas
Uiprobe renders both sources and places them on a shared canvas with markers highlighting every detected difference. You choose how to inspect: with a draggable split that reveals the design and the page as you move it, layered with adjustable opacity, or through a pixel-level diff. The comparison covers spacing, typography, color, size, border, opacity, and content.
02
Structured findings
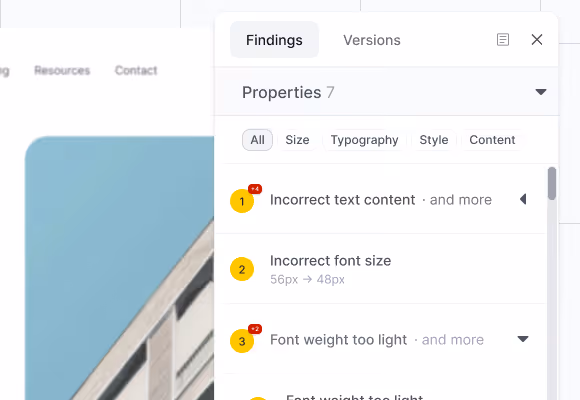
Findings grouped by type, not dumped into a flat list
Every probe run produces findings organised into three sections. Properties covers size, typography, style, and content differences. Spacing covers distance between elements. Unverified covers elements the system detected but could not fully map yet. Category filters let you isolate one type at a time.
03
Expected vs actual
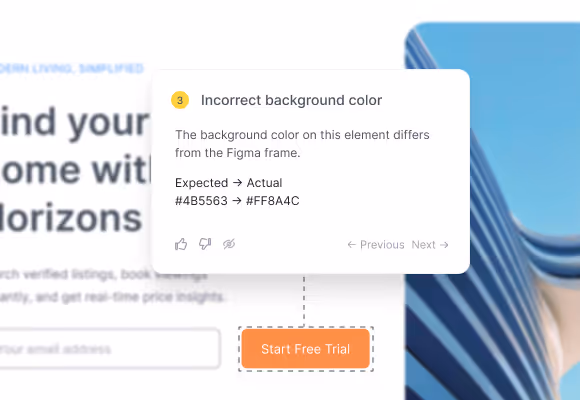
What the Figma frame specified. What the page rendered. Side by side.
Select any finding on the canvas or in the panel and its annotation card opens. The card shows the expected value from the Figma design and the actual value from the live page. Font weight, spacing in pixels, hex colour, border radius. You see the numbers and decide what matters. Navigate between findings without leaving the canvas.
02
More tools for the review
The details that make the difference during inspection
Every probe comes with controls to adjust how you inspect, what you share, and how strict the comparison is.
1
View modes
Five ways to inspect the comparison: horizontal or vertical split, overlay with adjustable opacity, pixel-level diff, or isolated Figma and web views.
1
Public links
Share probe results with a link. Reviewers inspect findings and navigate versions without signing in or creating an account.
2
Recurring patterns
When the same deviation appears across multiple elements, findings are grouped into one pattern. Twenty identical spacing shifts read as one row, not twenty.
2
Spacing tolerance
Three levels control how strict the spacing comparison is. Pixel-perfect shows every deviation. Standard filters the noise. Flexible surfaces only significant shifts.
04
Version history
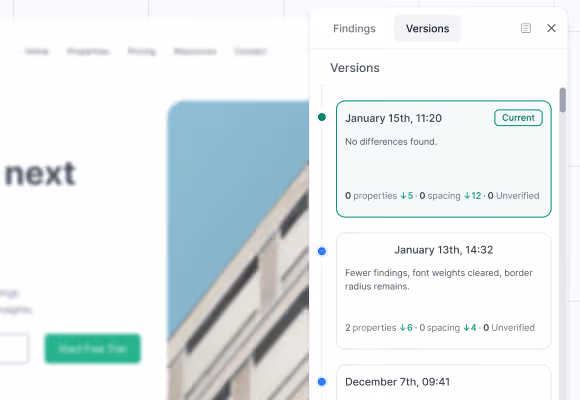
Every run is a version. Compare any two to see what changed
Each probe run creates an immutable version. The versions panel shows section counts and a per-section delta so you see at a glance how many findings cleared and how many remain. Navigate to any previous version to review past results. Nothing is overwritten, nothing is lost.
05
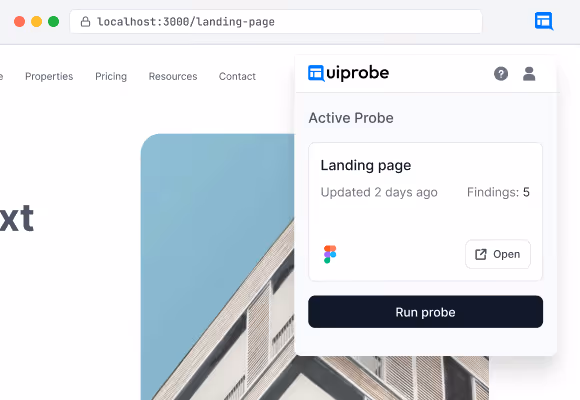
Chrome Extension
Compare Figma designs to localhost, staging, and login-gated pages
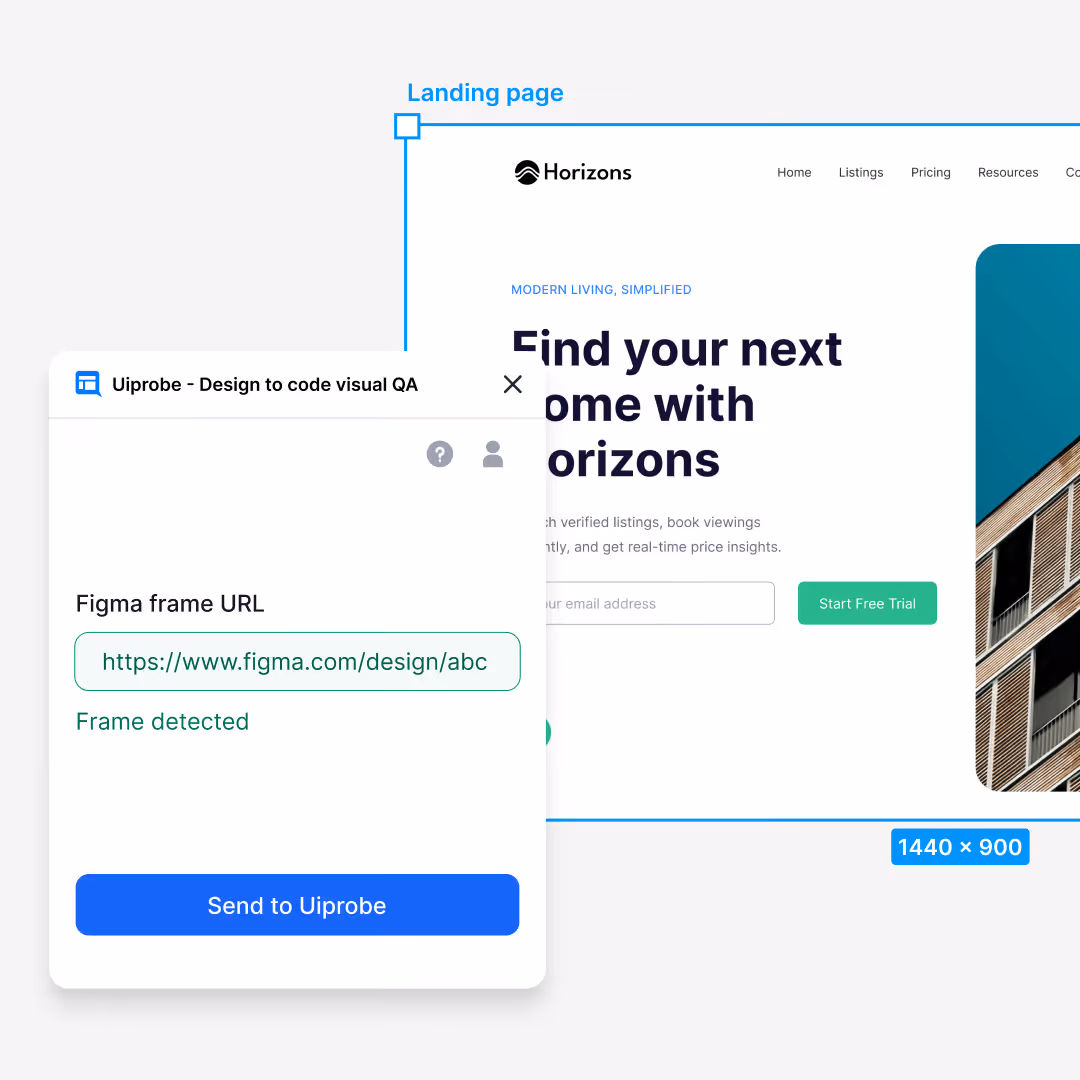
Most real development happens on pages a cloud tool cannot reach. The Chrome Extension runs comparisons on any page Chrome can reach. Open the page, paste the Figma frame URL, and run. The webpage URL fills in automatically from the active tab.
Working in Figma already? Open the plugin, pick a frame, and it lands in the web app as a draft probe, ready to pair with the page you want to compare it against. No copying frame URLs by hand.
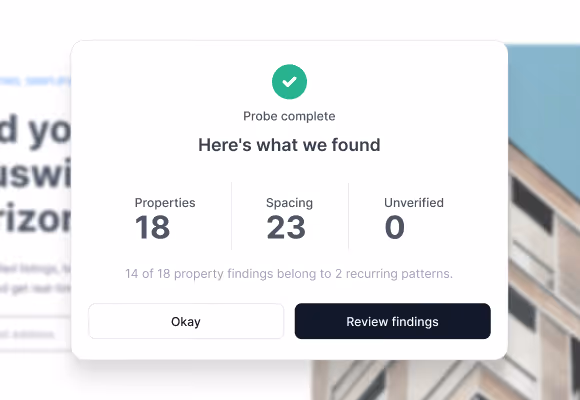
A structured summary before you start reviewing findings
When a probe run completes, a summary tells you where things stand: how many findings per section, how the count changed since the last run, and where to focus first. When you get to zero, the summary confirms it. No differences found. That's the moment the work is done and the result is worth sharing.
Stop pixel-peeping by hand.
Free to start. No credit card. See your first comparison in under a minute.