You can compare your Figma design against localhost using a browser extension. Unlike web-based comparison tools, which require a publicly accessible URL, a browser extension runs inside the browser itself — which means it can reach localhost the same way you can. No deployment, no tunnelling, no workarounds.
The standard workaround for localhost comparison is to push to staging first. It works, but it adds a step that exists only because the tool can't reach a local URL. You deploy, you check, you find differences, you go back to local to fix them, you deploy again. The loop is longer than it needs to be.
The better moment to check is while you're still building. The code is open, the context is fresh, and a spacing value that's 4px off takes seconds to fix. The same fix a day later, after the branch has been reviewed and merged, requires reopening something that was considered done.
A browser extension runs inside the browser, not on a remote server. When you open localhost:3000 in Chrome, the extension can see that page the same way you can. There's nothing to configure and no tunnelling required. The page never needs to leave your machine.
This also means login-gated pages work without any extra steps. If you're logged in to the app in your browser, the extension runs in that authenticated session. Pages behind a login, behind a feature flag, or on a private staging environment are all reachable the same way.
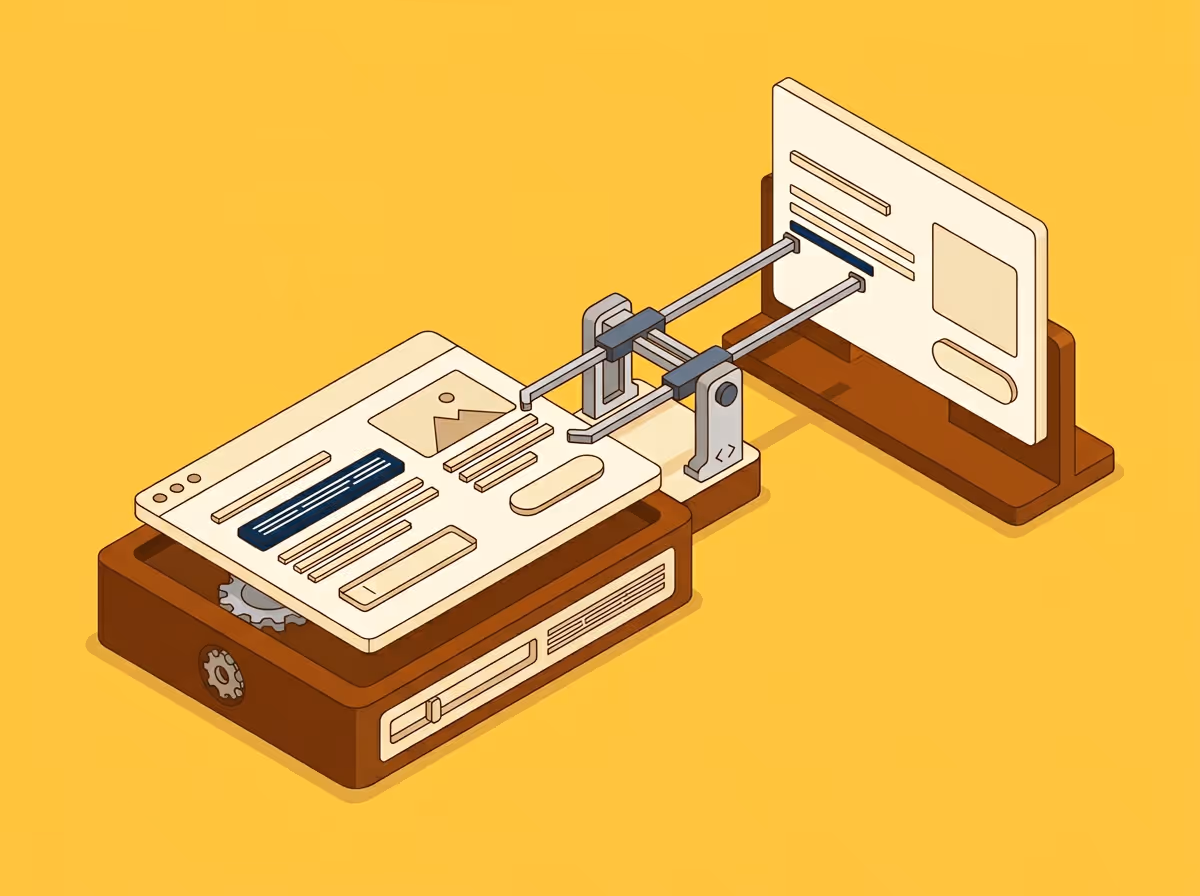
You open the page you're working on locally. The extension picks up the current tab. You point it at the Figma frame you're implementing against. It runs the comparison and shows you what's off — font weights, spacing between elements, component dimensions, colours — with specific values rather than impressions.
The output is the same as running a comparison against any other URL. The differences are listed with what the design specifies and what the implementation shows. You fix what matters, re-run, and check again. The whole loop happens in the browser, on the local version, before anything is deployed.
The useful moment is before you mark something ready for review. Not as a final audit, but as a check you run when you think you're done — the same way you'd read through code before submitting a pull request. It takes a few minutes and catches the things that would otherwise surface in review.
Running it partway through implementation is also worth doing, particularly on complex pages. Small deviations caught early are easier to trace back to a specific decision. The same deviation caught at the end requires more investigation to understand where it came from.
Uiprobe's Chrome Extension works on localhost, login-gated pages, and private staging environments. For step-by-step instructions on running a probe from the extension, see Use the Chrome Extension for non-public webpages.
Free to start. No credit card. See your first comparison in under a minute.
The fastest way to see how your implementation compares to the design. No screenshots, no guessing
Compare
© 2026 · Built by UIPROBE
